
Michael's Blog
Enterprise Consciousness
Tuesday, February 16th, 2010
On Friday I paid a long-overdue visit to my friend and advisor Julie. She is an expert
in leadership and Team dynamics, and
an experienced executive. We spent quite a lot of time talking about LiveSPC and my vision
for Your Enterprise Visual Workplace™. She pointed-out that studies find dramatic
benefits from communicating enterprise goals, and teaching the Team about how the enterprise
functions, the needs of its Customers, and how it makes a profit.
In particular, the
Watson Wyatt 2008/2009 WorkUSA Survey Report
indicates that employee
engagement is critical to increasing productivity and reducing employee turnover.
 Engagement is "Focus and direction that enable employees to understand what to do to
make their organizations successful."
Engagement is "Focus and direction that enable employees to understand what to do to
make their organizations successful."
The study concludes, "Companies can sustain engagement over the long haul by creating
a culture of continuous engagement built on strong strategic direction and leadership,
intense customer focus, equitable rewards and effective internal communication. Companies
that excel in these areas can enjoy better individual and organizational performance and
deliver superior long-term financial results."
By providing a vehicle for engaging the Team around the enterprise goals, processes, and
performance, LiveSPC drives improved productivity and job satisfaction. Here's how:
- Set goals & communicate them
Use a top-level workplace for the Enterprise to focus attention on key
performance goals. Setup live feeds of revenue, gross margin, backorder quantities,
order fulfillment time, etc. Measure from both enterprise and Customer viewpoints:
goals critical to enterprise success, and metrics that indicate customer satisfaction.
Measure these on a schedule that fits your business. For web-enabled retail
operations this could be quite often, perhaps daily or even hourly.
- Increase process knowledge & engagement
Pick some key processes and infrastructure of the enterprise, and analyze them
to select metrics. Build a workplace for these internal processes and work
with your Team to monitor and analyze them. The Team will immerse themselves in the
process and gain insight into the relationships that drive performance.
- Drive performance improvements
Once you've identified the key processes, and collect their performance metrics,
you can enlist the Team to follow, discuss, and improve the processes. Use the
interactive discussion feature to capture the analysis and conclusions of the Team.
Much of the improvement will be the result of the individuals who participate directly
in the processes making changes in their own work. In the "Visual Workplace" these
changes come naturally from the new level of awareness and understanding. The
resulting improvements stick and become the new way.
- Increase productivity
Now you're engaged with the whole Team, have a new focus on the enterprise and
the Customer, have the tools to understand what's going on in processes, and people
know what it takes to succeed. With this engagement and understanding, performance
will increase and employees will view their work in a better light.
Through an effort to deploy Your Enterprise Visual Workplace™ you can raise your Enterprise
Consciousness, build greater Team engagement, and take performance to new levels.
Cheers,
Michael
|
BI: Business Introspection
Monday, February 1st, 2010
Web Analytics are for the extrovert. The focus is external: Who is visiting my site?
What do they read? What brought them to our site? What format is most appealing to them?
How long did they stay? How can we convert them into Customers?
Capturing your market is what it's all about, so we
measure the Customer's behaviour. But what does the introvert measure?
After successfully capturing the Customer we must satisfy them. Satisfying the customer
demands effective and efficient operations to deliver the goods or services promised.
So now the focus shifts to the process: How are we performing?
 Are there roadblocks to
overcome? How are our suppliers performing? Do we have the materials and supplies required
to operate? Are our facilities and infrastructure operating properly?
Are there roadblocks to
overcome? How are our suppliers performing? Do we have the materials and supplies required
to operate? Are our facilities and infrastructure operating properly?
Measuring and analyzing your internal processes, I'll call it Business Introspection,
is what LiveSPC.com is all about.
The question of what to measure is best answered after some study of your processes.
Start with a very simple, high-level, flowchart of key enterprise processes. Don't get
too elaborate at first, start by identifying the products of a process and what inputs
are required to keep it running smoothly.
Success can be judged by measuring and analyzing the process outputs. This is a great way to
highlight goals, and communicate about your progress towards them. The big payoff, however,
comes from measuring the inputs to your processes that are critical to success.
Those inputs that are not directly controllable by you are especially important to measure.
When critical inputs go bad, you can expect your process to go bad. If you are measuring
those critical inputs then it is possible to catch problems before they impact your process
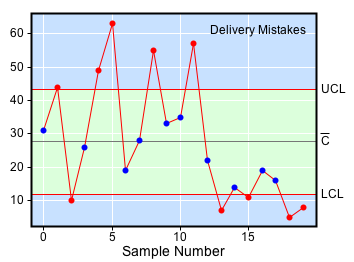
and the resulting products. Statistical Process Control charts are a great way to
analyze and recognize troubling patterns in your inputs before they begin to affect
the product.
I'll circle back to the topic of SPC charts in a later blog, but first we must measure
process products and inputs. Whatever you measure, start small and build from there.
Start with a process you know to have problems. You'll be amazed at what you can
discover by analyzing high-level process flowcharts. These discoveries will guide you
to choose which data to collect, and the analysis to apply.
Once you start the measurements, and live feeds to LiveSPC, you can construct
and share reports with the Team. Then you'll be calling on the most powerful analytic
resource you have: the amazing visual power of the human brain!
Cheers,
Michael
|
Can we talk?
Friday, January 15th, 2010
Well, yes we can... The discussion forum element is completed.
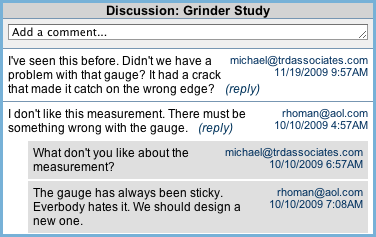
Now you can include a cell in your report for an online discussion, similar to Facebook's
news feeds. Comments can be entered, and replies to comments, by you or any of your subscribers.
Each comment or reply is labeled with the email address of the author, and a date/time stamp.
 This simple feature adds the most powerful dimension to LiveSPC: the Team
social context. Now the data, and your analysis of it, becomes the topics for
discussion in a forum accessible by your whole Team. Important details about
what was measured, either cause or effect, can be described and recorded as a part of
the report.
This simple feature adds the most powerful dimension to LiveSPC: the Team
social context. Now the data, and your analysis of it, becomes the topics for
discussion in a forum accessible by your whole Team. Important details about
what was measured, either cause or effect, can be described and recorded as a part of
the report.
There are several great uses for this feature.
In the simplest form it can be used to record your own notes about data you are
collecting and following as an individual: What have you discovered about the special-cause
event recorded today? Why did the process go out of control? What decision did you
make about the process? Record anything that could help to understand the process being monitored
or how it could be improved.
A more powerful application involves the people who are owners of a process or
activity being monitored. The discussion forum allows every member of the Team to
contribute their own thoughts or analysis of the data: What implications are there?
How can we improve? Has this happened before? What is the root cause?
Another great application involves managing relationships with customers or
suppliers. You can use Your Visual Workplace™ as way to exchange performance data
with your Customers, or to collect it from your suppliers. Your suppliers can feed a dataset
and build a report for you to follow important metrics that impact your relationship. A
discussion forum included in the report(s) can capture additional information to
complete the picture, or capture problem mitigation and resolution.
I hope you'll take a few minutes to try a discussion forum in some of your reports.
Then, I'd be happy to hear your thoughts and ideas.
Next, we have two technical improvements in mind for LiveSPC: A better report editor
to allow more flexibility in size and placement of cells; and an aggregation function
for client-browser JavaScript taps that will allow collecting data for a specific
sample period, in one or more observations, into a single sample record.
Cheers,
Michael
|
A New Face & Clean Skin
Tuesday, December 29th, 2009
Here's hoping you had a great holiday shared with family and friends. In the midst of
the holidays we still managed to get some new materials on the website, freshened-up
the website face, and continued technical refinements. You'll notice a little more artistic
presentation, with more pictures and instructional materials.
 We've added a "Quick-Start" section to help people complete their
first Visual Workplace more quickly. It describes how to sign-up, build a dataset, and setup
a report that displays the dataset. It's all pretty simple stuff, but a few instructions
should make it easier to get started.
We've added a "Quick-Start" section to help people complete their
first Visual Workplace more quickly. It describes how to sign-up, build a dataset, and setup
a report that displays the dataset. It's all pretty simple stuff, but a few instructions
should make it easier to get started.
We've also finished the first draft of the Executive Summary. The summary provides an
overview of the use of the Visual Workplace concept in the enterprise, driving goals and
measuring progress, and how social interactivity is key. In coming weeks we hope to add
more examples of reports and datasets that will help demonstrate how to apply Your Enterprise
Visual Workplace™ to your business or activity.
While adding the new materials we've also started to use CSS styling more
uniformly, underneath it all. Now we can take advantage of the strict standard HTML DTD for
better cross-browser compatibility.
Oh, yes, and we fixed some bugs... mostly relating to differences between browsers. JavaScript
gives you access to the inner workings of the web document, but browsers are not all
alike in how they implement the standards. It's a good puzzle, though, and fun to work through.
Changes to LiveSPC.com are going to be more rigorously tested going forward... it's
essential now that a greater variety of browsers are being used.
Thanks to Alan for feedback on the labeling of charts and the Date/Time processing on the
X-Axis. I made a second pass throught the code to refine its behaviour
and robustness. Every bit of experience is helpful at this stage, so please contact me if
you find a problem or have a requirement that is not being met.
As of earlier today datasets can now be sparsely populated, i.e. they can contain blank observations.
This capability allows the addition of a new column to an existing dataset without
providing observations for the past. This is particularly useful for run charts, but can
be applied to any dataset.
Finally, I may be ready to add the most important feature of all to LiveSPC: the workplace
discussion forums. As I mentioned previously, these will provide a discussion forum that is
associated and stored as a part of the visual workplace. People can then discuss and
evaluate metrics as a team, and capture conclusions and decisions. This is an essential
part of the LiveSPC concept, it's time to get it done.
Happy New Year!
Michael
|
Time Is On Our Side Now
Monday, December 14th, 2009
We've had a busy week here at LiveSPC.com. We continued our market analysis,
added important functionality, and continued gaining experience with
the product.
Our marketing work has focused on the high-level concepts and message of LivesSPC:
What are the key facts about the product that should be highlighted on the website
and in our communication to potential customers? We're preparing to add a little more
artistic presentation to the website, with information to help people better
 understand the product, what benefits they can expect from using it, and how they
may use it in their own situation. I get more excited every day about the
potential of LiveSPC as I see examples and envision future developments.
understand the product, what benefits they can expect from using it, and how they
may use it in their own situation. I get more excited every day about the
potential of LiveSPC as I see examples and envision future developments.
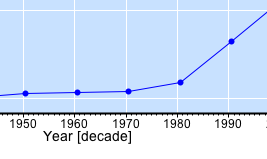
LiveSPC.com delivers it's greatest
potential in operations or projects, both dealing with metrics sampled over
time: web analytics, operational metrics, project earned
value, etc. This week we've added logic to display appropriate time units on the
X axis of LiveSPC graphs. Now, any recognized date/time text in the sample label
will be properly parsed and plotted, with natural tick marks chosen for the scale
of time in the dataset.
 So now, whether you are
monitoring your blood pressure, website visits, sales amounts, click-through rates,
or project earned value, you can use the calendar time to describe each sample. So now, whether you are
monitoring your blood pressure, website visits, sales amounts, click-through rates,
or project earned value, you can use the calendar time to describe each sample.
You can also use any descriptor for the X axis, like 'Sample 1', 'Sample 2', etc.,
or any numeric value, and the chart will use that value for X.
This week we've also implemented a
Pareto Chart option for
displaying the frequency of values in a dataset. One application of the Pareto chart
might be to analyze the reasons for a product complaint reported by your Customers, or the
type of defects in a product, or the step in your software process where a bug was injected.
Finally, this week we've completed a prototype for a client-browser module for
feeding live data. Now you can submit a new sample directly from JavaScript in your
web page without any server script or cron job. This works great for any data you wish
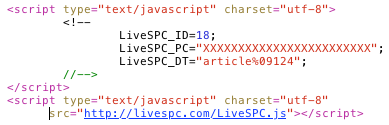
to capture from a form or other script results. All you have to do is embed this:
in your web page source. The var LiveSPC_DT gets delivered and parsed into the dataset.
LiveSPC_PC is a special code that is an MD5 hash of the passcode and the domain (you have
to enter it) that will be allowed to feed data. You copy it from the bottom of the
'edit this dataset' page. The LiveSPC_ID is the dataset ID number.
LiveSPC_DT is tab-delimited text that gets parsed into a new row in the dataset.
Note the '%09' tab embedded in the text.
I'm using client-side feeds now to track which articles people read on
water-rockets.com.
Note the Pareto chart in the upper left corner showing the frequency of the different
article numbers being viewed.
The Pareto will update when each new page is rendered. Great fun to watch, the bars
grow and shift around over time, but a bit like watching paint dry, though, at 20 or
25 hits per hour. :-)
Cheers,
Michael
|
The Curious & The Brave
Monday, December 7th, 2009
Many thanks to those of you who have been testing LiveSPC this past week. Your
feedback is invaluable at this early stage of development.
 Armed with your feedback, I have spent most of the week working on usability and
robustness issues. I fixed a couple of very important bugs in the CSV importer
that should make the feature more useful.
Armed with your feedback, I have spent most of the week working on usability and
robustness issues. I fixed a couple of very important bugs in the CSV importer
that should make the feature more useful.
I've also done some work to make the reports look better. I changed the sizes of
stoplights and gas gauges to make them align better with the other graphical forms
on a report page.
As you continue to explore LiveSPC please contact us if you have any trouble, or would
like to suggest a feature or idea. I am particularly keen on hearing from you if
you are setting-up a live data feed.
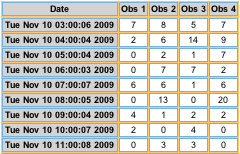
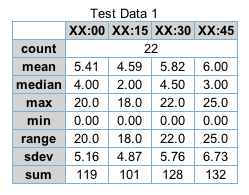
Last week I also added some new data representations:
- Bar Graphs for datasets with one or many observations.
- Basic Statistics in table that summarizes sample observations.
- P Chart for displaying failures in a sample population.
- C Chart to analyze variation in count data.
I have planned 2 additional representations: Box Plot, and Pareto Chart for
analyzing variation and attribute data. I may get to them later this week.
This week I also have plans to prototype a feature that will properly display time
scales for the X axis on run charts and bar charts. Time scales will make the charts
more useful in the context of operations and projects by relating them to the
calendar.
With your help LiveSPC gets more useful every day. Keep those data coming, and
email your thoughts and ideas!
Cheers,
Michael
|
Building-Out the Capability
Tuesday, December 1st, 2009
Since last report I have been concentrating on three main efforts;
building examples of LiveSPC in action, developing instructional materials on the site,
and refining and debugging the implementation.
Here are the simple examples I've created so far,
these are public reports that anyone can view:
I'm writing overview and instructional pages forcusing on three interests based on
roles: Executive, Analysts, and Developer.
For the Executive I will focus on the use of LiveSPC to drive performance
and communication in the enterprise. LiveSPC can be used to set goals and communicate them to
the Team, provide data to reflecting results toward those goals, and a social forum
where discussions can build ownership and good descision-making.
For the Analyst
(yes all you LiveSPC users are analysts!)
I've written some guidance on what to measure and how to choose an appropriate graphical
representation to enable analysis.
The Developer page describes
the steps necessary for setting-up a live data feed to a LiveSPC dataset.
Clayton, Erica, and I continue to make progress analyzing the market for
the LiveSPC service. We're conducting value-chain analysis that considers
key activities, requirements, benefits, competitive advantage, and ownership from the
perspective of 5 prototype companies.
 The 5 companies were chosen to represent market
segments or potential candidate enterprise types. The goal is to identify those
companies that can most benefit from LiveSPC, and identify the key features and services
that enable the greatest benefit.
The 5 companies were chosen to represent market
segments or potential candidate enterprise types. The goal is to identify those
companies that can most benefit from LiveSPC, and identify the key features and services
that enable the greatest benefit.
Once this analysis is completed we should be ready to build a list of companies,
and begin the sales process.
I've also started prototyping the social discussion element that can be included in
any report page. The idea is to provide a discussion forum that is associated and
stored as a part of the visual workplace. People can then discuss and evaluate metrics
as a team, and capture conclusions and decisions.
Cheers,
Michael
|
LiveSPC.com is Live!
Thursday, November 19th, 2009
It's been an exciting 2 1/2 weeks getting the new LiveSPC.com
website built and operational. By operational, I mean it is usable
with some important limitations.
Here's what's working:
- User sign-up email verification process.
- create, edit, and store datasets for collecting your data.
- create, edit, and store Reports that display graphical representations
of your dataset(s).
- Feeding live data via secure protocol to append to, or replace, a dataset.
- Importing and exporting CSV files.
- Sharing a report with another registered user.
- Making a report or dataset
publicly viewable or embeddable.
The following graphical representations are implemented:
- Red-Yellow-Green stoplight for status annunciation.
- Gas Gauge with control and specification limits annunciated.
- Run-chart that displays sample points connected by a line.
- X-Bar chart to analyze variation between subgroups.
- R chart showing variation within a subgroup.
- Histogram chart to display the distribution of Y values.
- Blank report cell.
The remaining graphical representations are waiting on a new way of
classifying sample labels and observation values so that configuration
choices can be made automatically. The goal here is to make it easy to use any
of the graphical representations without having to make technical choices, or
to at least provide an appropriate initial selection.
If you are interested in using the live data feed capability then
you'll need some information and code. A short list of
instructions are available. I've got reference
code and a library written in Perl. If you feel like implementing a shell-script,
Python, or ???, version I'd appreciate the help. Contact me at info@livespc.com
and I can explain the protocol. It's really simple.
This has to be considered an "Alpha" release, so please be understanding.
I will do my very best to keep the database safe, but at this pace of development
a lot can happen. I'll do my best... hmmm... let's see, bargraphs are next.
Cheers,
Michael
|
|